
Local visibility
How to Compare Local Ranking Scans Fairly
Keep scan conditions consistent, separate measurement gaps from changes, and report patterns without exaggerating cause or business impact.
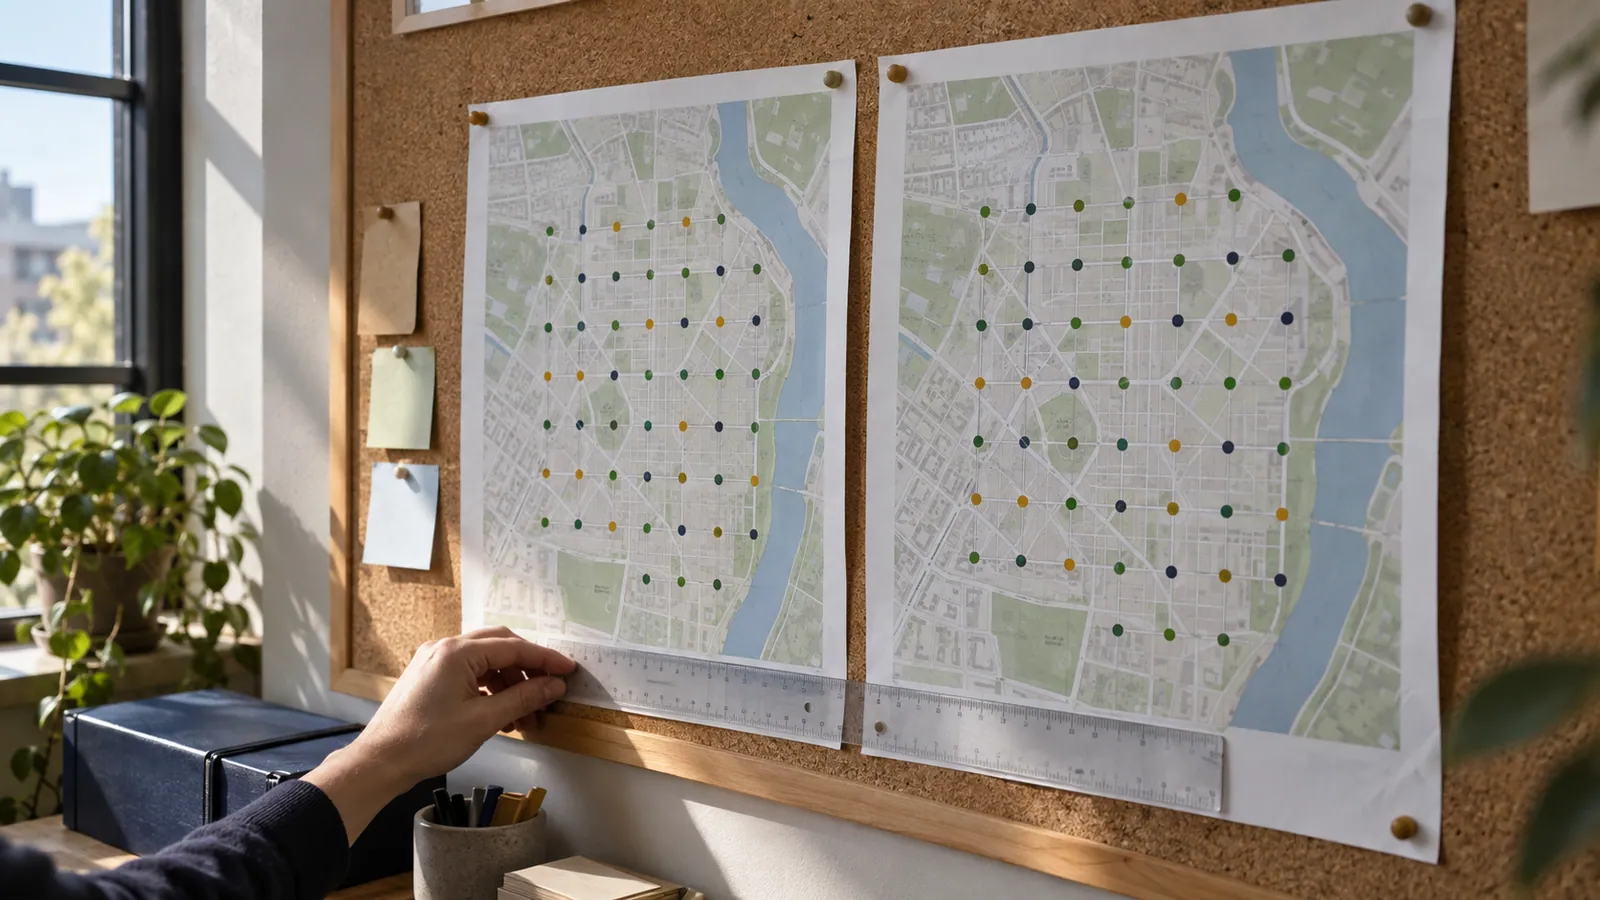
A before-and-after comparison is useful only when “before” and “after” measure comparable things. A better-looking second map may reflect a smaller grid or a different query rather than improved visibility. Fix comparability before writing the conclusion.
Create a comparison contract
Record the exact business identifier, query, scan provider, result type, center coordinates, grid size, spacing, ranking limit, and any supported language or device settings. Keep those settings consistent between periods. Save the raw exports if available, not just cropped screenshots.
If you intentionally change the setup, start a new baseline and explain why. A broader service-area test can be valuable, but it should not be presented as a direct continuation of a smaller scan.
Inspect the data before calculating change
Check for failed points, missing scans, out-of-range markers, and changes in the tool's definition. Do not replace an unknown result with a made-up rank. If the tool changed, document the limitation and avoid overprecise percentage claims.
For an illustrative 25-point grid, suppose 10 points were in the top three initially and 14 later. That is four additional points, or a change from 40% to 56% of the sampled grid: 16 percentage points. It is not a 16% increase in leads, and the grid does not represent every possible searcher. The numbers here are an example, not client results.
Look at geography and commercial relevance
Identify where positions improved or weakened. Ask whether those areas correspond to the services and customers the business can actually serve. A broad average can conceal a drop in an important neighborhood and improvements in places with little practical relevance.
Use more than two observations when feasible to distinguish a persistent pattern from an isolated result. Note holidays, changes in service demand, profile edits, and campaign work as context. Their timing does not prove they caused a movement.
Write the comparison in three layers
First, report the observation: which comparable points changed. Second, state the limitation: missing data, sample area, or short time window. Third, choose a next action: validate a service page, review profile accuracy, or repeat the measurement.
Google's published ranking factors provide context, but they do not turn a two-scan comparison into a causal experiment. Local ranking framework.
Frequently asked questions
### Can I compare screenshots with different zoom levels? Only after verifying that the underlying measurement points match. Resizing images alone does not make different coordinates equivalent.
### Should I remove weak points from the report? Do not selectively remove unfavorable observations. If the business needs a new geographic scope, state the reason and create a new baseline.
### What is a useful monthly conclusion? One clear observed change, one limitation, and one accountable action. Keep actual calls, appointments, and revenue in their own measured categories.
Sources and further reading
Continue with this related guide
Reviewed September 5, 2026. Practical examples are illustrative, not client results.