
Local visibility
How to Read a Local Ranking Heatmap
Read query, grid spacing, rank limits, and geographic patterns before turning a colorful map into a local visibility decision.
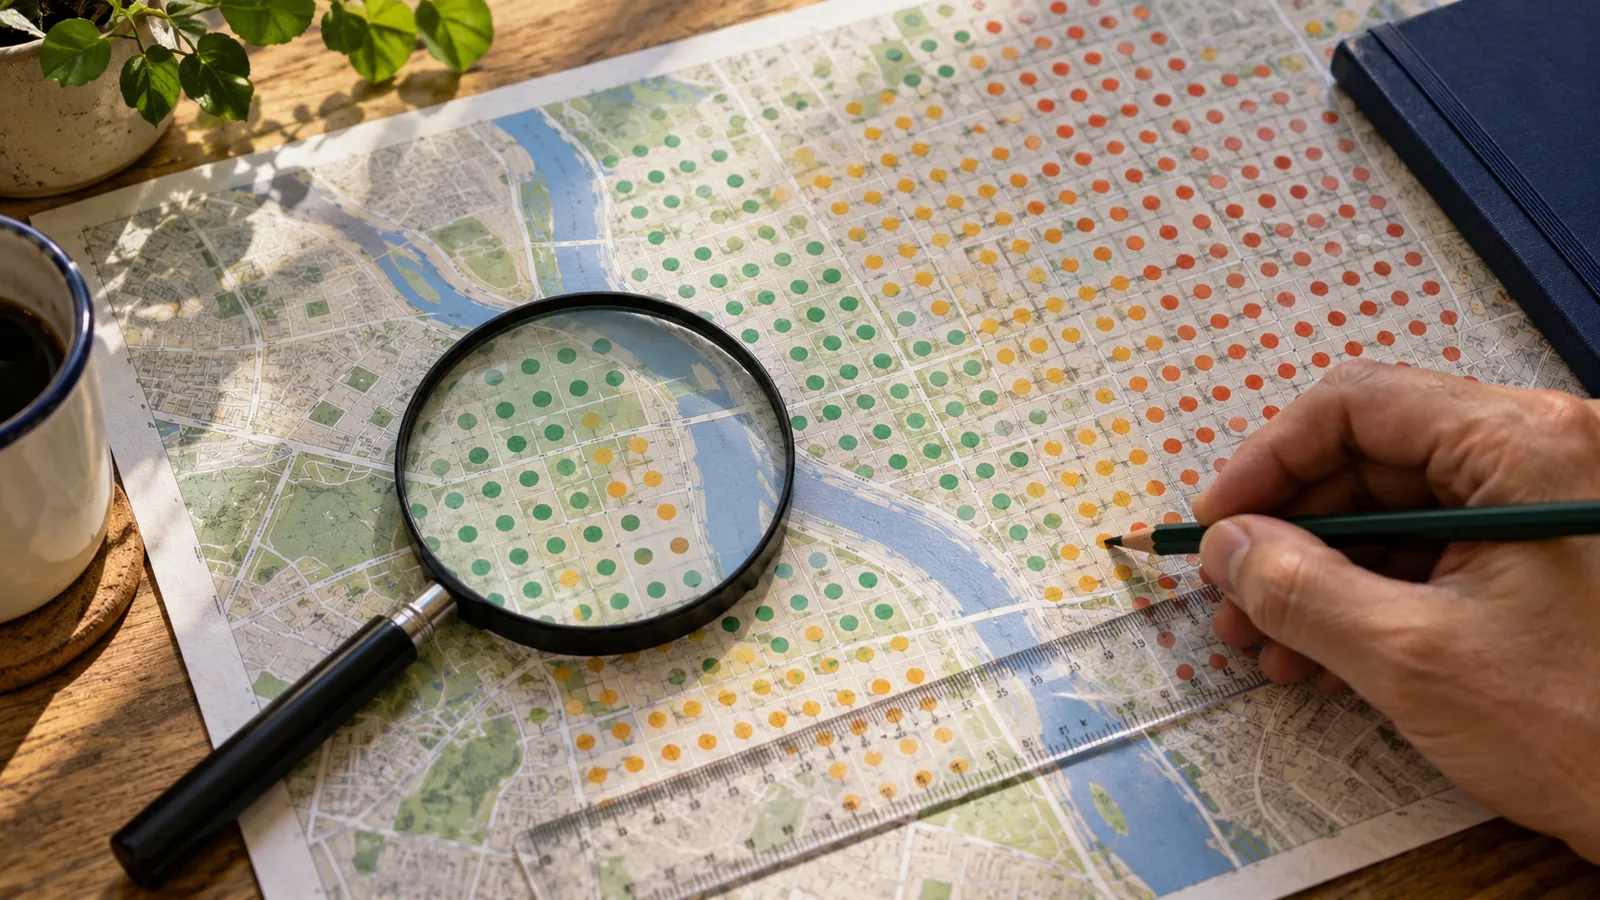
A green map can look reassuring and a red one alarming, but color is only the last layer of a ranking report. Before judging performance, understand what was searched, where the search was sampled, and what the tool can actually report.
Read the scan settings first
Find the exact query, target business, scan date, map center, grid dimensions, distance between points, and ranking cutoff. Also note the result type and any device or language settings supplied by the tool. Without those details, two attractive maps may describe different tests.
A narrow grid around the business and a broad grid across a region do not answer the same question. Neither is automatically wrong. The useful choice depends on the area and services the business is trying to evaluate.
Understand the legend and missing results
Read the tool's own legend before interpreting a number. A value such as “20+” may mean the business was outside the scanned result limit, not that its exact position was 21. A failed or unavailable point should not silently be treated as a poor ranking. Keep measurement gaps distinct from measured outcomes.
Use the map to inspect groups of points, not just the best square. Look for consistent strength near the center, a boundary where positions weaken, or a pocket that differs from surrounding points. Those patterns suggest questions; they do not identify causes by themselves.
Explain one illustrative pattern
Suppose a hypothetical scan shows stronger positions near the business and weaker positions farther away. That can be consistent with location-sensitive results. Google includes distance in its published local-ranking framework, alongside relevance and prominence. It does not mean the business should create a false address at the edge of the grid. Google's ranking guidance.
The practical next step is to review whether the query matches an important service and whether the geographic area is commercially relevant. A weak point far outside the actual service area may be less urgent than a service page that confuses nearby customers.
Write a restrained conclusion
Use this structure: “For [query], the [date] scan showed [pattern] within [area]. The scan used [spacing and limit]. We recommend checking [one issue] and comparing again with the same settings.”
Do not translate sampled positions directly into calls or revenue. Connect the visibility report to separate customer-action and sales records before discussing business outcomes.
Frequently asked questions
### Is the average rank enough? No. Averages hide geography and depend on how missing or out-of-range results are handled. Review the map and calculation rules together.
### Why does my own search look different? Your location, wording, timing, and search environment may differ from the scan. A manual search is another observation, not a universal correction.
### What should I save for next month? Save the original scan, settings, query, date, and interpretation. That makes the next comparison reproducible instead of relying on memory.
Sources and further reading
Continue with this related guide
Reviewed September 5, 2026. Practical examples are illustrative, not client results.